Problem
- Client context: Korea Electrotechnology Research Institute
- Requested scope: app-platform
- Business tags: Manufacturing, Web
This service is available to members only.
#Manufacturing, #Web
Korea Electric Power Research Institute The Korea Electric Power Research Institute (KEPRI) is a leading institution in the field of electric power research and technological advancement in South Korea, conducting various power-related research and projects. Among these, the Power Demand Forecasting Platform plays a crucial role. This platform is an essential tool for national power management and efficient power distribution, ensuring the stability of power supply through accurate demand forecasting.
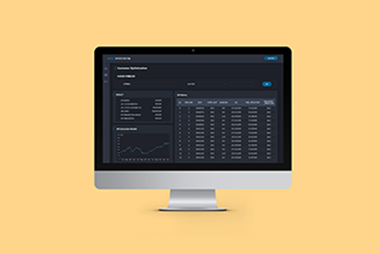
Power Demand Forecasting Platform User Interface Development IT7 Project Overview This project involves developing the user interface (UI) for the Power Demand Forecasting Platform of the Korea Electric Power Research Institute. The main goal is to effectively visualize large-scale electric power data and provide a user-friendly interface. Particularly, the platform must handle large volumes of data for power demand forecasting and present it in an intuitive and easily understandable manner.
Responsive Website In modern web development, responsive design is a fundamental element. To provide the best user experience across various devices and screen sizes, we adopted a responsive web design. This ensures that users can experience consistent interfaces and functionality whether they are using desktops, tablets, or smartphones. We implemented responsive design using the latest CSS technologies and media queries to create a flexible and adaptable layout.
Large-Scale Data Visualization One of the core functions of the Power Demand Forecasting Platform is to process and visualize large-scale data in real-time. For this purpose, we utilized various data visualization tools and libraries. In particular, we implemented interactive 3D charts using D3.js. D3.js is a powerful library that enables data-driven document manipulation, optimized for visually representing complex data structures.
3D Chart Implementation Using D3.js By leveraging D3.js to implement 3D charts, we enabled users to understand power demand forecast data more intuitively. 3D charts allow for a more comprehensive view of the data compared to simple 2D graphs, making it easier to grasp various aspects of the data at a glance, especially the changes over time and the correlations between different variables. This enhances users' ability to deeply understand and analyze the data.
Big Data Processing The Power Demand Forecasting Platform needs to process vast amounts of data in real-time, making efficient data processing and management crucial. To achieve this, we applied optimized database structures and efficient data query techniques. Additionally, we adopted the latest web technologies and frameworks to ensure real-time data updates and fast response times.
User Experience (UX) Enhancement User experience (UX) was one of our top priorities. We designed an intuitive interface with simple navigation and visually appealing designs to make it easy for users to use the platform. Furthermore, we continuously improve the interface by incorporating various user feedback. This ensures that users can utilize the platform more conveniently and quickly obtain the information they need.
Conclusion The Power Demand Forecasting Platform of the Korea Electric Power Research Institute is a critical tool for enhancing the efficiency of power management. Through our UI development, we support users in understanding and utilizing large-scale data more easily. By applying responsive web design, 3D charts using D3.js, and big data processing technologies, we provide the best user experience. We promise to continue improving and updating the platform to offer better services in the future.